Stock screeners can quickly become overwhelming: ROIC, ROE, free cash flow growth, operating margins, debt, valuation multiples, momentum, volatility…
All of these metrics can be useful. But do you really need to configure dozens of filters just to answer a fairly simple question: “Which companies best match the way I want to invest?”
That is exactly what the PrimeStrider Simple Screener is designed to do: turn an investment philosophy into a few understandable choices, identify the companies that best fit those preferences, and then let you examine how such a selection behaved historically.
Start with an investment philosophy, not 50 ratios
When analysing a company, several dimensions usually overlap. A business can be highly profitable but expensive. Another may be growing rapidly while having weaker financial quality. A third may look cheap but remain out of favour with the market for years.
Instead of immediately asking investors to configure every individual ratio, PrimeStrider groups the analysis around a few broad dimensions:
- Quality — favour companies with stronger fundamental and financial characteristics.
- Growth — give more importance to the expansion of revenue, earnings and the business itself.
- Valuation — favour companies trading at more reasonable valuations relative to their fundamentals.
- Momentum — incorporate both recent and longer-term market trends.
- Dividend — place greater emphasis on shareholder distributions and income-related characteristics.
The goal is not to claim that one perfect combination exists. It is to make explicit a decision every investor is already making, consciously or not: what matters most to me?
Build a screener with just a few sliders
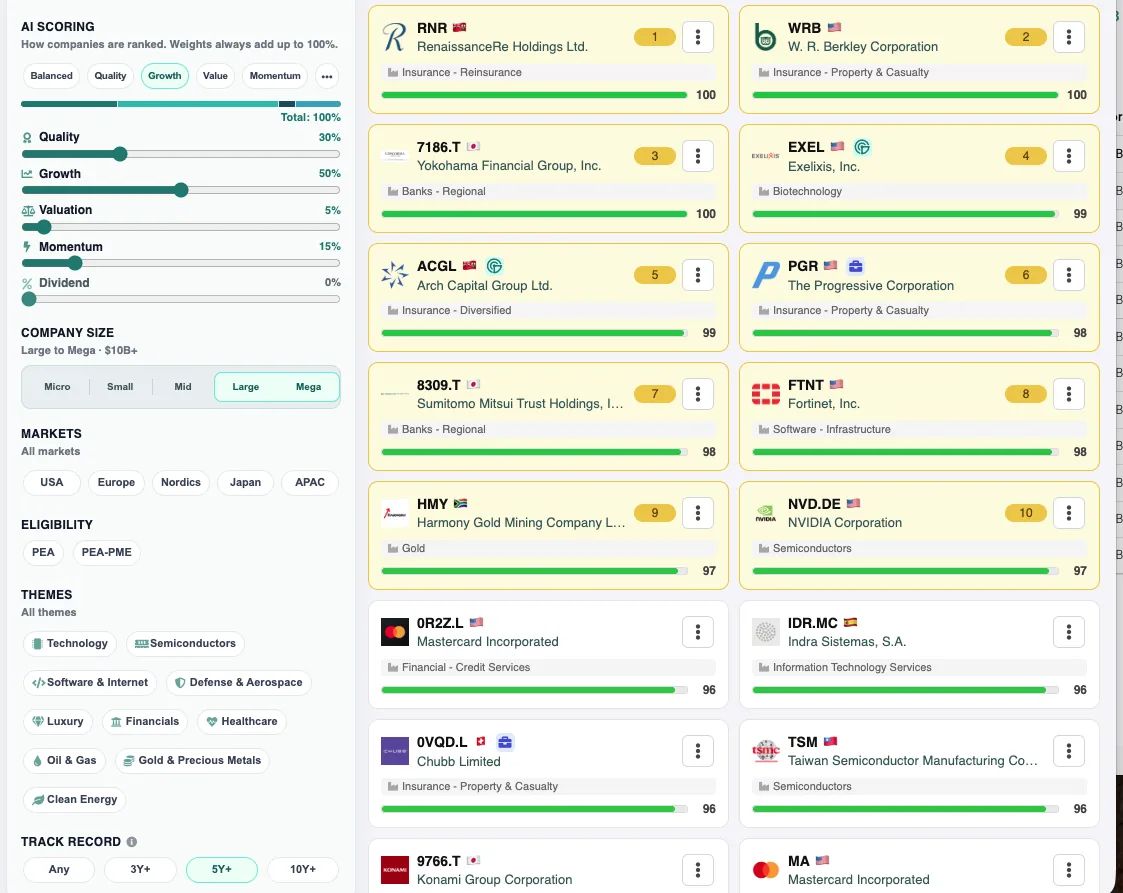
In Simple mode, the weighting sliders can be used to quickly create, for example, a more growth-oriented approach, a balanced strategy, or a selection that places more emphasis on valuation.
The total remains at 100%, so increasing the importance of one factor naturally reduces the relative importance of the others.
You can then refine the investment universe using more intuitive criteria, such as:
- company size;
- markets or geographic regions;
- investment universes such as PEA or PEA-PME;
- themes or sectors;
- minimum listing history.
PrimeStrider then produces a ranking. The score is neither a forecast of future share prices nor a buy recommendation. It simply shows which companies best match the criteria you selected.
Why ranking can be more useful than a simple yes/no filter
Traditional stock screeners often work as a series of gates: P/E below X, ROE above Y, revenue growth above Z.
This approach is useful for very precise strategies, but it also introduces arbitrary cut-offs. A company sitting just below a threshold may disappear entirely, while another company only marginally above it remains in the selection.
A scoring system offers a different approach: compare companies relative to one another and surface those with the strongest overall combination of characteristics for your chosen strategy.
The result is therefore not a list of stocks “to buy”. It is a shortlist to investigate.
A good idea on paper is not enough: challenge it against history
Imagine that your screener identifies ten companies that rank particularly well. It can be tempting to stop there.
But before analysing each company individually, another question is worth asking:
“How would a portfolio made up of these companies have behaved under different market conditions?”
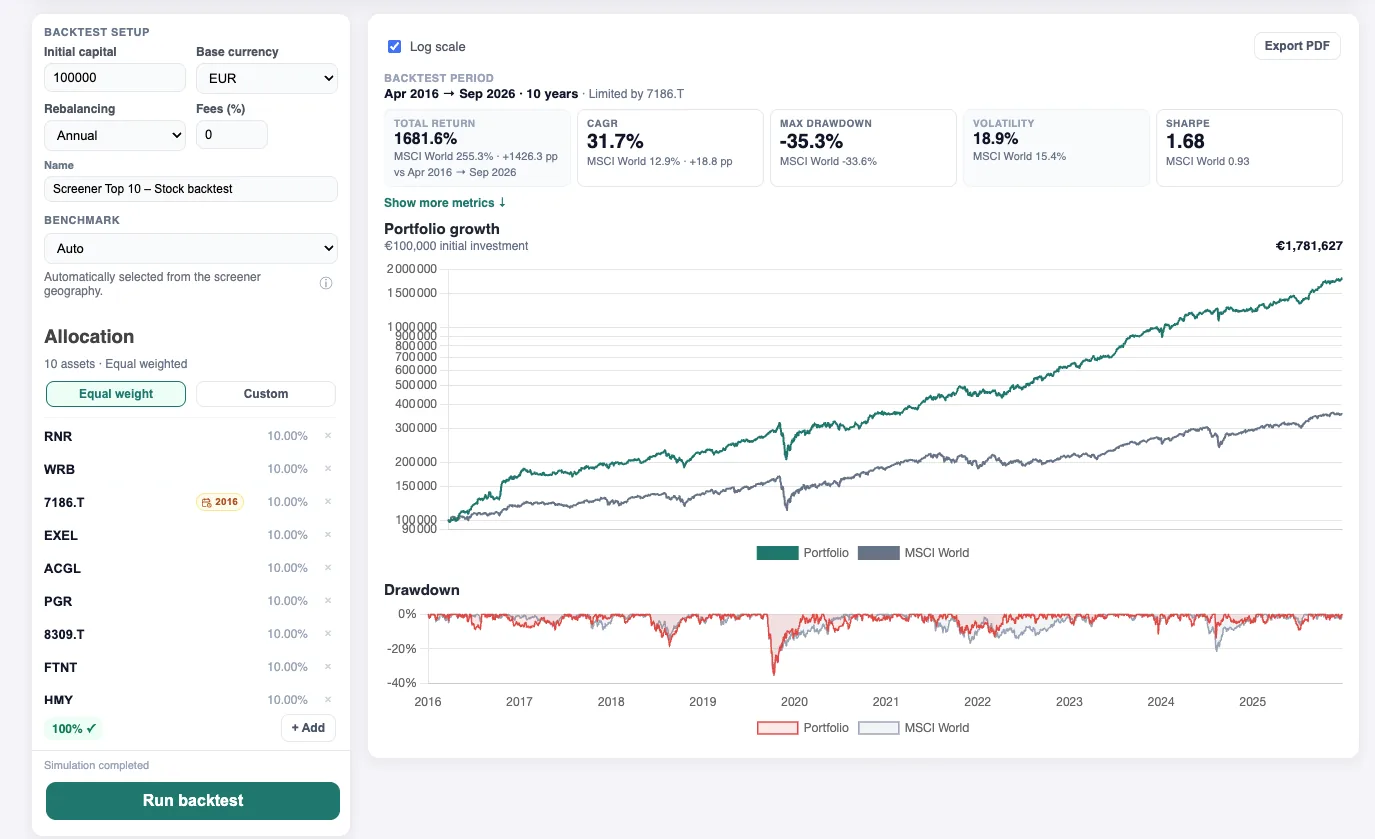
PrimeStrider lets you send a selection directly into the backtesting tool and examine its historical behaviour.
Do not look at returns alone
When a backtest shows an attractive performance curve, the natural first reaction is to look at the final return.
But that is far from the only number that matters.
PrimeStrider can help you examine metrics such as:
- total return over the simulated period;
- CAGR, or annualised return;
- maximum drawdown, measuring the largest peak-to-trough decline;
- volatility;
- Sharpe ratio, putting returns into perspective relative to risk;
- a benchmark, so the strategy is not evaluated in isolation.
Two portfolios can produce similar final returns while delivering completely different experiences to investors. A strategy that suffers several 40% drawdowns is not equivalent to one achieving a similar return with much smaller swings.
Important: a backtest is not a time machine
This is probably the most important rule in this article.
The more strategies you test, the easier it becomes to find a combination that would have performed exceptionally well in hindsight. This is one form of overfitting.
Several other biases also need to be kept in mind:
- selection bias: choosing companies today that you already know have performed well over the past decade can make historical results look artificially strong;
- survivorship bias: companies still visible today do not necessarily represent every company that existed at the beginning of the period;
- available history: some stocks have been publicly listed for far less time than others;
- fees, taxes and real execution conditions can reduce returns achieved in practice;
- a strategy may work well in one economic regime and struggle in another.
There is one particularly important distinction if the backtest uses companies selected today: it does not mean that your screener would necessarily have selected those exact same companies ten years ago.
A better way to interpret a backtest is therefore not: “I found a strategy that returns X%.”
Instead, ask:
“How did this selection behave across different market environments, and what risks would an investor have had to tolerate?”
Use backtesting to try to break your idea
Backtesting becomes much more useful when you use it critically instead of treating it as confirmation.
Try changing your assumptions:
- increase or reduce the number of stocks;
- change the historical period;
- compare against different benchmarks;
- change the rebalancing frequency;
- include transaction costs;
- adjust the balance between Quality, Growth, Valuation and Momentum.
If a strategy only looks exceptional with one extremely precise combination of parameters, that is useful information in itself.
A strategy that remains broadly consistent when reasonable assumptions are changed may deserve closer attention.
A simple workflow: Screen → Understand → Test
Simple mode is built around a straightforward three-step process.
- Screen. Define the characteristics you care about and build a shortlist.
- Understand. Examine the companies and understand why they appear in the ranking.
- Test. Use historical analysis to understand how the portfolio behaved, especially during difficult periods.
This makes it possible to move quickly from: “I want profitable companies with good growth, but I don't want to pay any price for them”
to a concrete list of companies worth investigating.
What if five sliders are no longer enough?
That is intentional.
Simple mode is designed to remove complexity when that complexity is not yet adding value.
But behind Quality, Growth, Valuation, Momentum and Dividend are, of course, many individual financial metrics.
When your investment process becomes more specific, PrimeStrider Advanced Mode lets you take back full control: individual metrics, numerical filters, custom weightings and much more precise rules.
You can therefore start with a simple question:
“What type of company am I looking for?”
…and gradually move toward:
“Which exact financial rules define my investment strategy?”
Start simple. Add complexity only when you need it.
Quantitative investing does not have to begin with a spreadsheet containing 200 columns.
Define your philosophy. See which companies rise to the top. Understand why they rank well. Challenge the selection across different market periods. Then, once you know exactly what you want to refine, move to the advanced tools.
That is the idea behind the PrimeStrider workflow: make investment research easier to start, without removing the depth advanced investors need.
Build your first stock screener
Adjust Quality, Growth, Valuation, Momentum and Dividend, explore the companies that fit your investment style, then challenge your selection against historical data.
PrimeStrider provides research and analytical tools. Scores, rankings and simulations do not constitute investment advice or recommendations. Past performance and backtested results do not guarantee future performance. Any investment decision should take into account your objectives, financial situation and tolerance for risk.