How to Screen PEA-Eligible Stocks and Backtest Your Strategy
France's PEA (Plan d'Épargne en Actions) gives investors access to hundreds of European stocks. Rather than searching at random, let's build a repeatable method to filter PEA-eligible stocks, rank them using several fundamental factors, and backtest the resulting selection.
- we start exclusively with PEA-eligible stocks;
- we rank them across 4 major groups of criteria;
- we keep the screener's Top 20 stocks;
- we simulate an equal-weighted portfolio with annual rebalancing;
- we compare the result with the STOXX Europe 600.
1. The real challenge: knowing where to look
When investing through a PEA, the challenge is not necessarily finding one interesting company.
The harder part is often knowing where to focus your research across a broad universe of European companies.
That is exactly what a stock screener is designed to do: start with criteria defined in advance and apply them consistently across the entire investment universe.
2. Start with the stocks that are actually PEA-eligible
A global stock screener may surface Apple, Microsoft, Nvidia or other excellent companies. But that does not solve the problem if your goal is to build a portfolio inside a Plan d'Épargne en Actions (PEA), the French tax-advantaged equity account.
In PrimeStrider, PEA eligibility can be used directly as a screening filter. In this example, we simply enable PEA and let the screener rank the companies that match our criteria.
3. Turn your investing style into measurable criteria
Here we use a relatively balanced combination, with a deliberate tilt toward quality and growth.
The goal is not simply to find the stocks with the lowest P/E ratios or the fastest growth rates.
We are looking for companies that offer a balance between quality, growth, valuation and market momentum.
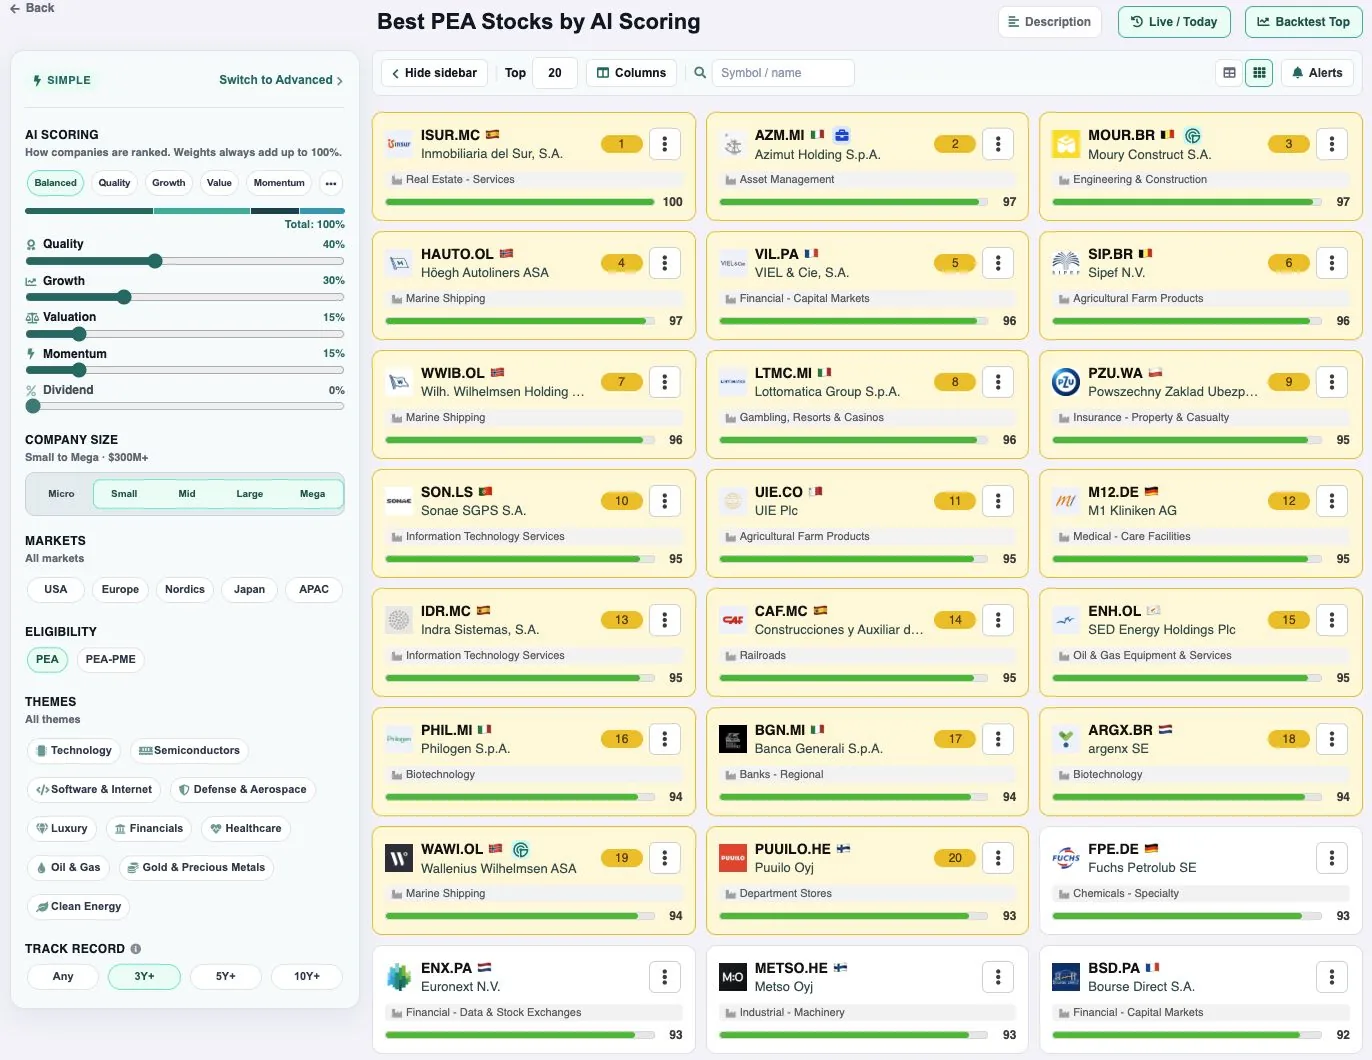
The screener is not there to decide which stocks you should buy. Its main purpose is to reduce hundreds of companies to a focused shortlist worth researching further.
4. Why not just use the P/E ratio?
Consider one of the most widely used valuation metrics: the price-to-earnings ratio, or P/E.
A low P/E ratio may point to an undervalued company. But it can also reflect a declining business, temporarily elevated earnings, a highly cyclical company or weak market expectations.
A combination of criteria lets you express a genuine investment hypothesis.
The same applies to growth. A company with exceptional growth may look attractive, but much less so if that growth is already fully reflected in an extremely high valuation.
A multi-factor approach therefore allows you to compare several dimensions instead of relying on a single number.
5. From the screener to the Top 20
Once the criteria are applied, PrimeStrider calculates the ranking that matches the selected investment hypothesis.
For this example, we keep the top 20 companies.
Universe
Filters
Scoring
20
This process has an important advantage: the rule is defined before you inspect each company individually.
That helps reduce the temptation to select only familiar stocks or companies with particularly compelling stories.
6. Backtest the screener's top-ranked stocks directly
A promising selection on paper is not enough. The next step is to examine how a portfolio built using the same logic would have behaved historically.
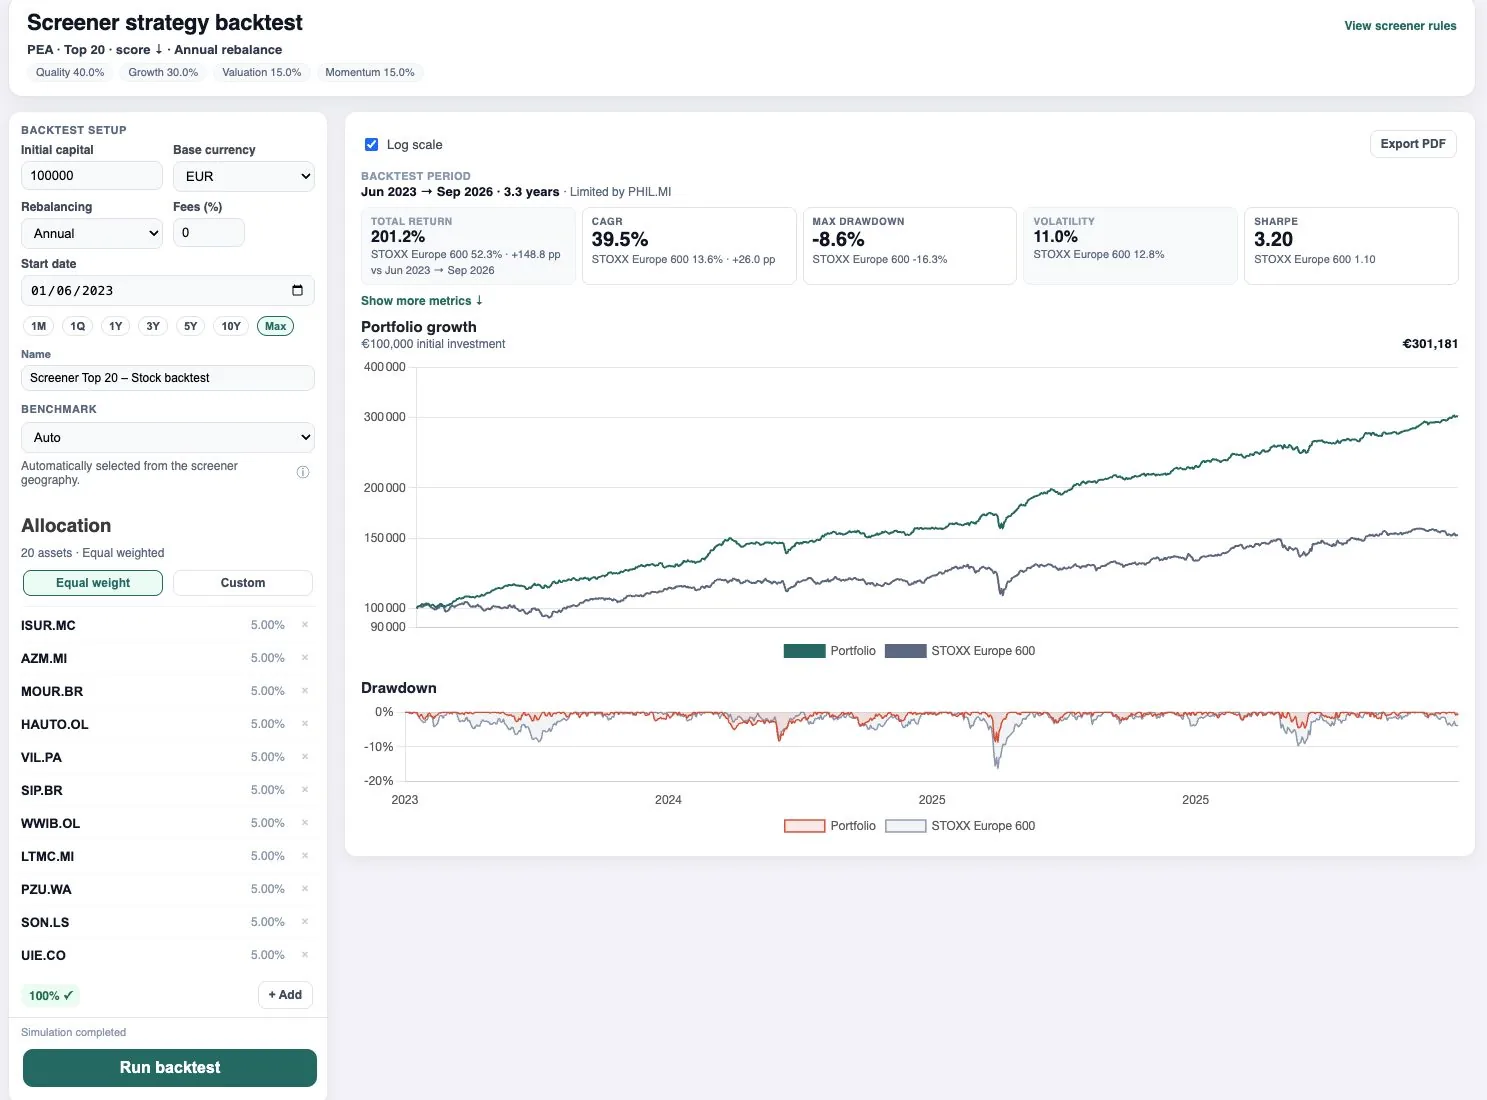
In PrimeStrider, the selection can be sent directly to the backtesting engine using Backtest Top.
We keep the twenty highest-ranked stocks returned by the screener.
Each position receives 5% of the initial portfolio value.
In this example, the portfolio is rebalanced annually.
Here, the portfolio is compared with the STOXX Europe 600.
7. What does this backtest show?
With a hypothetical initial investment of €100,000, the simulated portfolio reaches approximately €301,000 by the end of the tested period.
| Metric | PEA Top 20 | STOXX Europe 600 |
|---|---|---|
| Total return | +201.2% | +52.3% |
| CAGR | 39.5% | 13.6% |
| Max drawdown | -8.6% | -16.3% |
| Volatility | 11.0% | 12.8% |
| Sharpe ratio | 3.20 | 1.10 |
The results of this simulation are striking, but they do not mean that a similar strategy will deliver the same performance in the future.
In this example, the usable backtest period is limited to approximately 3.3 years by the available history of one of the stocks. That is a relatively short period for evaluating a long-term investment strategy.
8. What a backtest can actually tell you
The ending value naturally attracts the most attention. But it is not necessarily the most useful information.
9. Watch out for backtesting biases
To use a backtest properly, you also need to understand some of its limitations.
The choice of period
A strategy can perform extremely well in one market environment and be much less suitable in another.
Overfitting
It is tempting to keep changing parameters until you obtain the best-looking historical chart. But the more a strategy is optimized on past data, the greater the risk that you are merely explaining the past instead of building a robust investment process.
What information was actually available at the time?
It is also important to distinguish between taking a portfolio selected today and projecting it backward through history, and a true point-in-time simulation in which rankings are reconstructed using only the information that was actually available on each historical date.
This distinction is essential for avoiding look-ahead bias.
10. Test robustness instead of searching for the perfect backtest
A more disciplined approach is to change the assumptions slightly and see whether the overall investment logic remains consistent.
The goal is to test whether an investment idea remains coherent across several reasonable configurations.
11. From intuitive stock picking to a repeatable process
Many investors start with a company they already know: they hear about the stock, read a few analyses, look at the chart and then decide whether it deserves a place in their portfolio.
That approach can work, but it introduces a clear bias: you mostly analyse companies that are already on your radar.
A stock screener lets you reverse the process.
Quality, growth, valuation, momentum, dividends, company size, sector...
Companies are compared on a consistent basis.
Including companies you might never have searched for on your own.
The score is a starting point for analysis, not an automatic investment recommendation.
12. A simple process for screening PEA stocks
In practice, the screening process can be summarized like this:
Universe
Criteria
Ranking
Research
Backtest
This process obviously cannot tell you which stocks will be tomorrow's winners. What it can do is turn a relatively vague idea such as:
...into an explicit, measurable and testable investment hypothesis.
Build your own PEA stock screener
Adjust the filters, change the Quality, Growth, Valuation and Momentum weights, explore PEA-eligible stocks and backtest your selection directly in PrimeStrider.
Try PrimeStrider →