Most investors do not start with a formula.
They start with an idea: find profitable companies with strong cash flow, low debt and steady long-term growth.
The difficult part is turning that idea into an actual stock-screening methodology. Which profitability metric should you use? How much debt is too much? Should an expensive company be excluded entirely, or simply receive a lower score? And how should all those metrics be combined?
In this tutorial, we will use PrimeStrider to turn a simple investment thesis into:
- hard screening filters,
- a weighted stock-scoring model,
- a ranked global stock universe,
- and a historical backtest.
The goal is not to find a magical formula. It is to make an investment idea explicit, measurable and reproducible.
1. Start with the investment thesis
For this example, we want to identify established companies with:
- strong profitability,
- good cash generation,
- reasonable debt,
- positive long-term growth,
- and enough market history to evaluate them properly.
We also want valuation to matter, but we do not want to automatically eliminate an excellent business simply because its valuation is higher than average.
Price momentum and historical downside risk can be considered too, but they should remain secondary to fundamentals.
That gives us a simple hierarchy:
business quality → financial strength → growth → valuation → market behaviour
2. Describe the strategy in plain English
Instead of manually selecting financial ratios one by one, PrimeStrider's AI Assistant lets us describe what we are looking for in normal language.
Scoring prompt
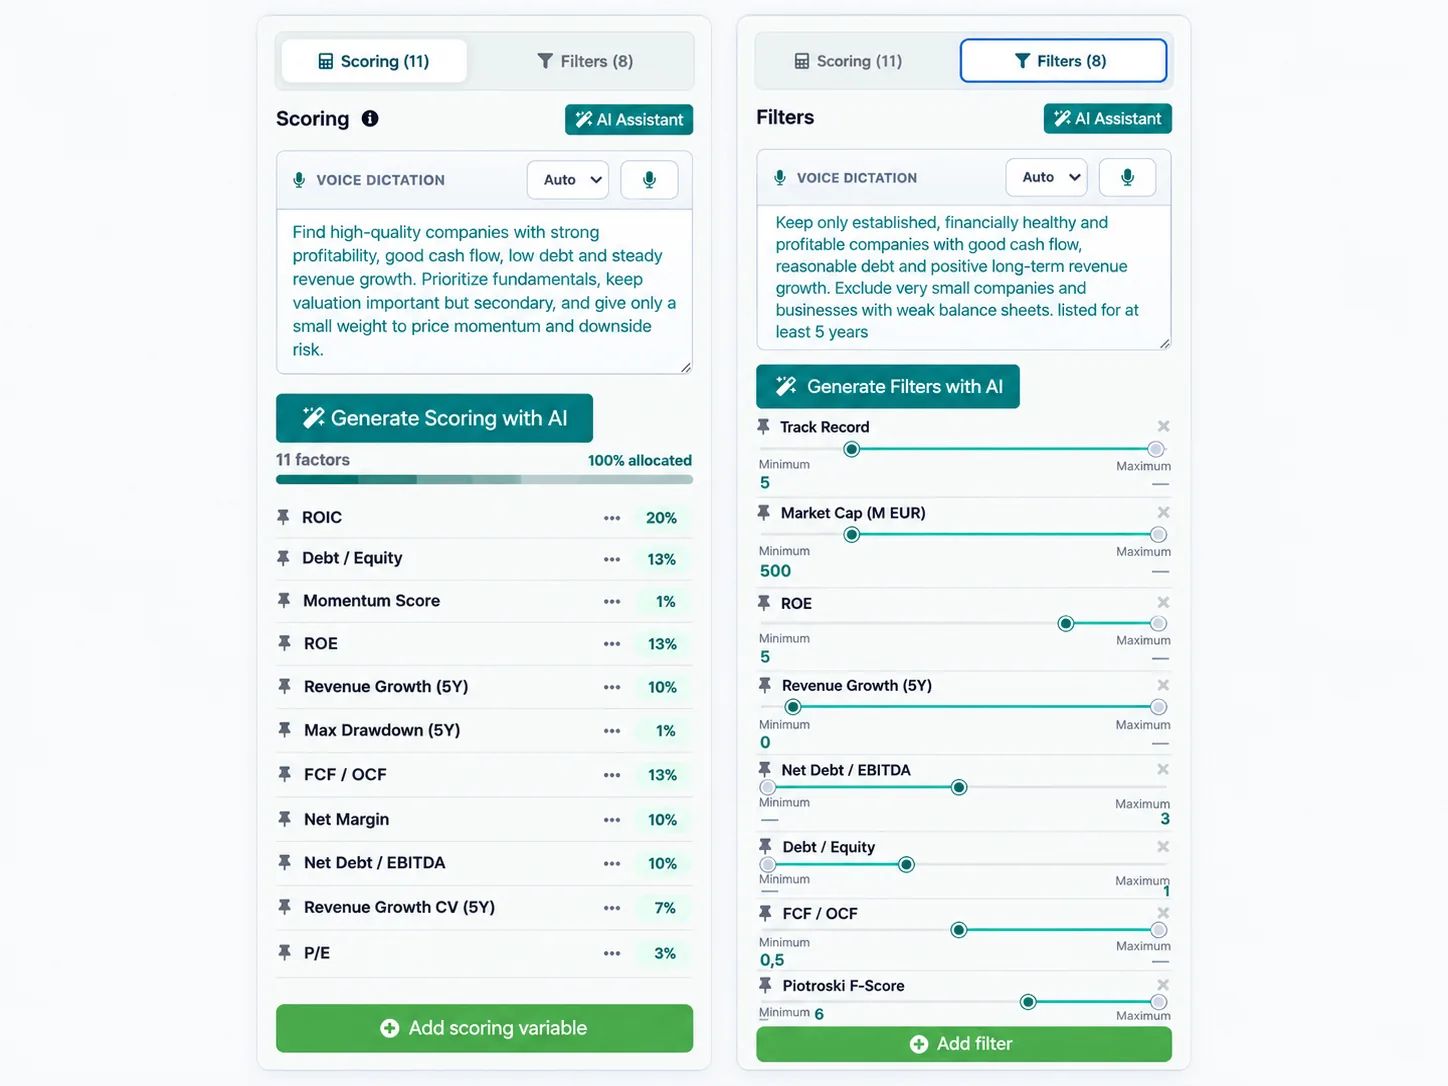
Find high-quality companies with strong profitability, good cash flow, low debt and steady revenue growth. Prioritize fundamentals, keep valuation important but secondary, and give only a small weight to price momentum and downside risk.
PrimeStrider translates that request into an explicit scoring model.
In this example, the generated model used 11 factors:
| Factor | Weight |
|---|---|
| ROIC | 20% |
| Debt / Equity | 13% |
| ROE | 13% |
| FCF / OCF | 13% |
| Revenue Growth (5Y) | 10% |
| Net Margin | 10% |
| Net Debt / EBITDA | 10% |
| Revenue Growth CV (5Y) | 7% |
| P/E | 3% |
| Momentum Score | 1% |
| Max Drawdown (5Y) | 1% |
The structure reflects the original thesis: profitability, cash generation and balance-sheet strength dominate the score, while valuation, momentum and downside risk play smaller roles.
Filtering prompt
Scoring tells us which companies we prefer. Filters define the minimum conditions a company must meet before it is ranked at all.
Keep only established, financially healthy and profitable companies with good cash flow, reasonable debt and positive long-term revenue growth. Exclude very small companies and businesses with weak balance sheets. Listed for at least 5 years.
PrimeStrider then converts this qualitative requirement into quantitative thresholds such as:
- minimum listing track record,
- minimum market capitalization,
- minimum profitability,
- positive long-term revenue growth,
- maximum leverage,
- minimum cash conversion,
- and minimum financial-quality scores.
3. Filters and scoring solve different problems
This distinction is important.
A filter is binary. A company either passes or fails.
A score is relative. A company can be excellent on one dimension and weaker on another while still remaining in the investable universe.
Imagine two companies:
- Company A has exceptional profitability, very little debt and strong growth, but trades at a relatively high valuation.
- Company B is cheaper, but has lower returns on capital and weaker growth.
If we use a strict valuation filter, Company A might disappear completely.
But our thesis says that quality is more important than cheapness. It therefore makes more sense to include valuation in the scoring model and let it reduce the company's score rather than automatically excluding it.
A useful rule of thumb is:
Filters define what you refuse to own. Scoring defines what you prefer to own.
4. Rank the remaining companies
Once the filters are applied, we still have a broad universe of eligible companies.
That is intentional.
Filters should normally remove companies that clearly contradict the investment thesis rather than reduce the universe to exactly ten or twenty stocks.
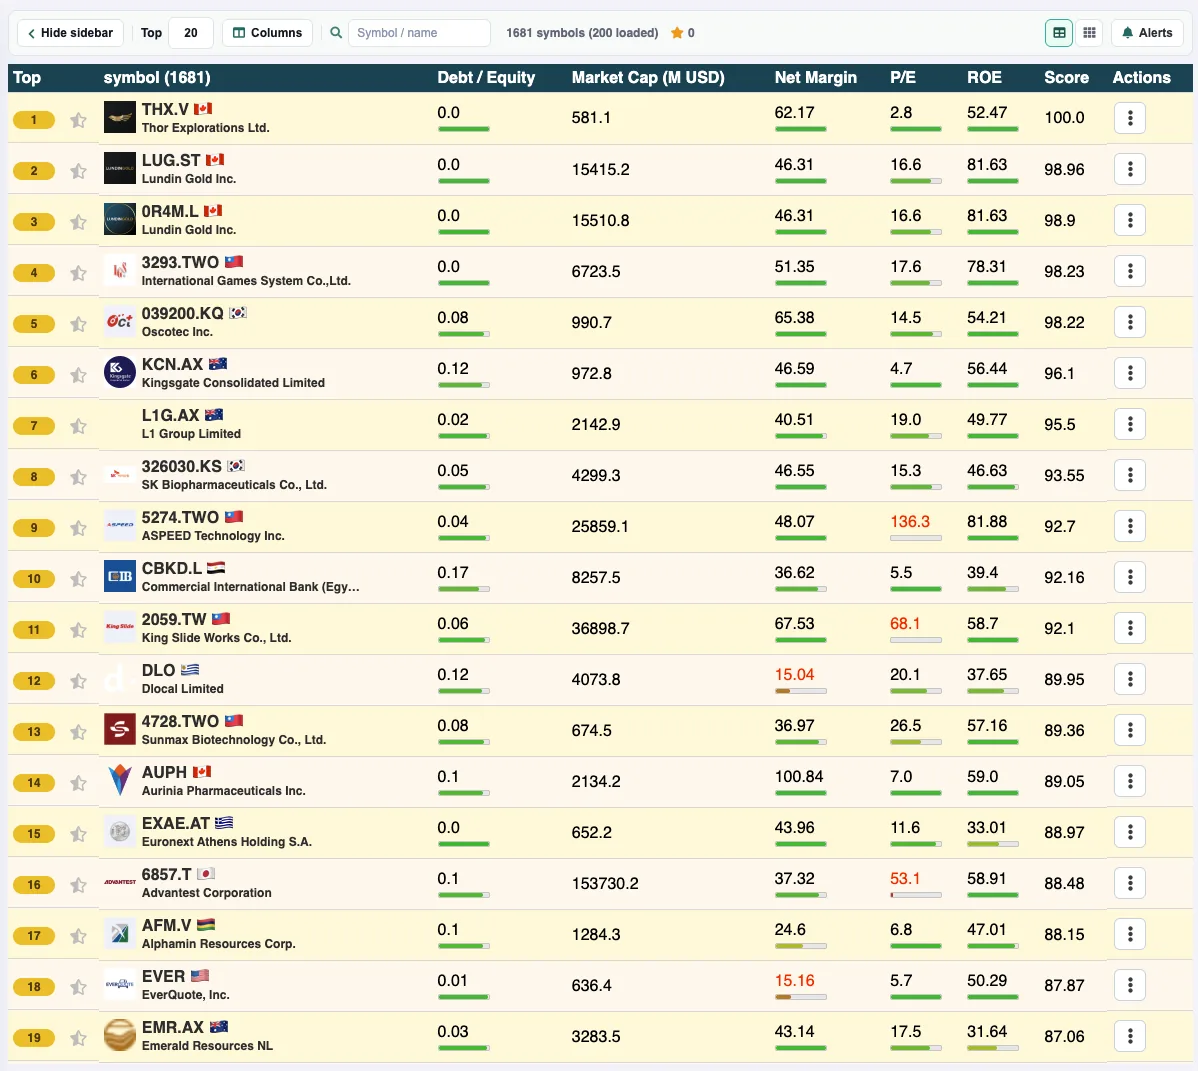
PrimeStrider then calculates the weighted score for every remaining stock and ranks the universe from highest to lowest.
The underlying financial data remains visible alongside the score, so the ranking is not a black box. You can inspect metrics such as:
- Debt / Equity,
- market capitalization,
- Net Margin,
- P/E,
- ROE,
- and the overall PrimeStrider score.
5. Why rank a Top 20 instead of choosing one stock?
The purpose of a systematic screener is generally not to identify one mythical “best stock”.
Financial metrics are noisy. Accounting structures differ between industries. Companies evolve, and even excellent businesses can experience poor market performance for extended periods.
A Top 10 or Top 20 portfolio lets us evaluate the behaviour of the screening methodology rather than relying on a single company.
For this example, we use the Top 20 stocks by score.
An equal-weight allocation is particularly useful for research because it prevents the largest company from dominating the result.
With twenty positions, each company initially represents approximately 5% of the portfolio.
6. Backtest the resulting strategy
The ranked selection can then be sent directly into PrimeStrider's backtesting module.
This completes the workflow:
investment idea → AI scoring → AI filters → ranked stocks → historical backtest
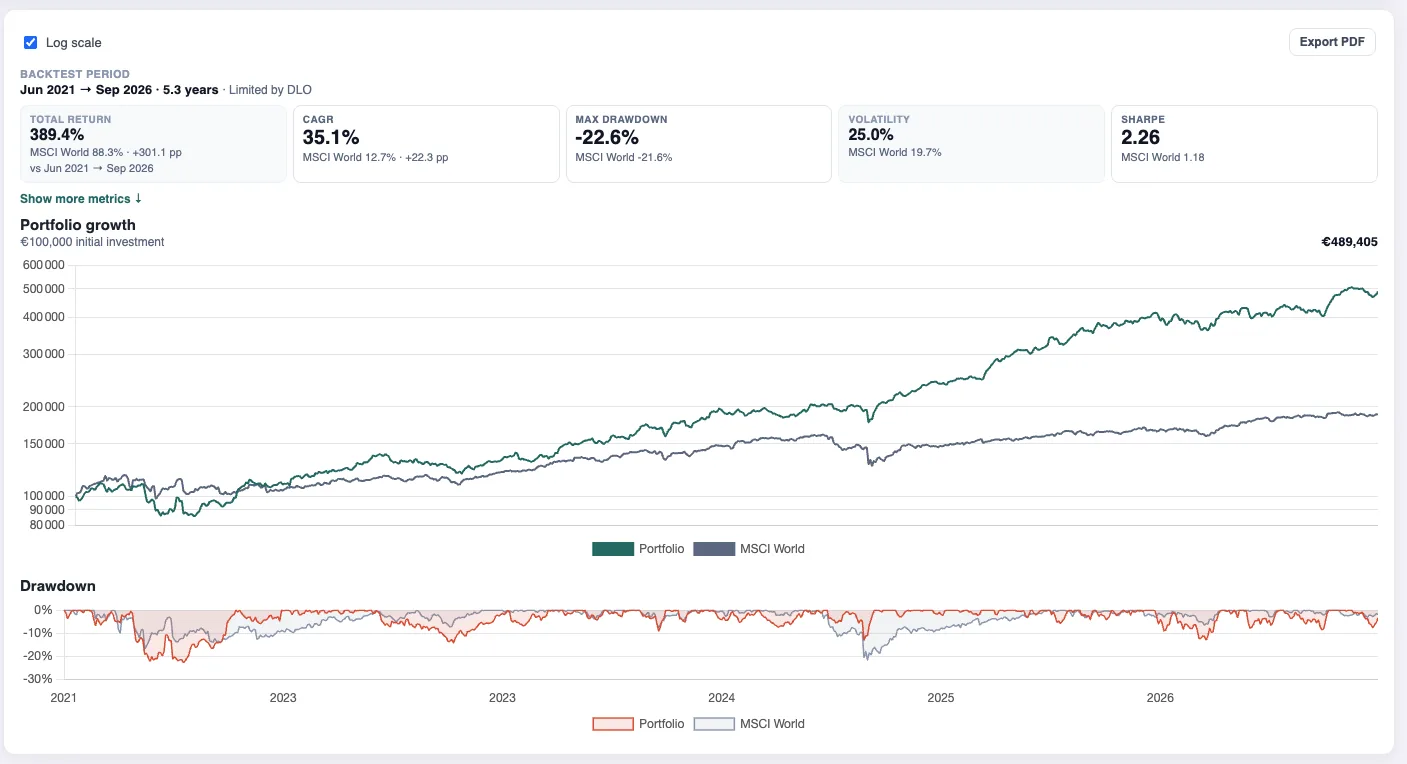
The portfolio can be compared with a benchmark such as the MSCI World and analysed using metrics including:
- total return,
- CAGR,
- maximum drawdown,
- volatility,
- Sharpe ratio,
- and relative performance against the benchmark.
7. Do not judge a strategy only by its final return
A backtest is much more useful when you look beyond the headline performance number.
Maximum drawdown tells you how severe historical losses were.
Volatility gives an indication of how unstable the return path was.
The Sharpe ratio helps put historical returns in the context of the risk taken.
Comparing the equity curve with a benchmark can also reveal whether the strategy's outperformance was persistent or concentrated in a small number of periods.
In other words, the goal is not simply:
Which strategy produced the highest historical CAGR?
A better question is:
Did this investment methodology behave the way I expected it to behave?
8. A backtest is not a forecast
Strong historical results should never be interpreted as a promise of future performance.
Backtests can be affected by many factors, including:
- the chosen start and end dates,
- the available historical data,
- the construction of the stock universe,
- survivorship bias,
- look-ahead bias,
- rebalancing assumptions,
- transaction costs,
- liquidity,
- and corporate actions.
There is also an important methodological distinction between selecting companies using today's data and reconstructing exactly what an investor could have known at each historical date.
A true point-in-time backtest requires historical fundamentals and historical selections built only from information available at the time.
Historical simulation is therefore best used as a research and stress-testing tool, not as a prediction engine.
9. Avoid optimizing the strategy after seeing the backtest
One of the easiest mistakes in systematic investing is to continuously modify a screen until historical performance looks impressive.
You increase the minimum ROIC.
You adjust the growth threshold.
You remove one factor and add another.
You run the backtest again.
Eventually, you may discover a combination that performed extremely well in the past — but only because it was fitted to historical noise.
A more disciplined process is:
- define the investment thesis,
- translate it into explicit rules,
- review the methodology,
- freeze the main assumptions,
- and only then inspect the historical results.
That is the process used in this example.
10. AI builds the starting point — you remain in control
You may decide that:
- ROIC deserves less weight,
- valuation deserves more weight,
- momentum should be removed entirely,
- two leverage metrics overlap too much,
- your minimum market capitalization should be higher,
- or a particular financial-quality metric does not fit your investment universe.
You can change the factors, weights and thresholds manually.
That means AI acts as a strategy-building assistant, not as a black-box stock picker.
11. Try the same workflow with other investing styles
The same process can be used for many different strategies.
Value investing
Find profitable companies trading at inexpensive valuations relative to earnings and cash flow. Prioritize strong balance sheets and avoid highly leveraged businesses.
Growth investing
Find companies with strong and consistent revenue growth, improving profitability and healthy balance sheets. Growth quality should matter more than short-term price momentum.
Dividend investing
Find established companies with sustainable dividends, strong free cash flow, reasonable payout ratios and resilient balance sheets.
Quality at a reasonable price
Find highly profitable companies with strong returns on capital and reliable cash generation, but penalize companies trading at excessive valuations.
The workflow remains the same:
describe → generate → inspect → filter → rank → test.
From an idea to a reproducible investment process
A useful stock screener should do more than provide hundreds of filters.
It should help investors turn an investment idea into a methodology that can be inspected, modified and tested.
In this example, we started with a simple request:
Find high-quality companies with strong profitability, good cash flow, low debt and steady revenue growth.
From that idea, PrimeStrider created:
- an 11-factor weighted scoring model,
- a set of quantitative minimum requirements,
- a ranked global stock universe,
- a Top 20 selection,
- and a portfolio that could be historically tested against a benchmark.
The important part is that every step remains visible and editable.
You can disagree with the AI, change the assumptions, compare alternative strategies and test whether the resulting portfolio behaves the way you expected.
Build your own AI stock screen
You can reproduce the same workflow in PrimeStrider.
Start by describing the type of companies you want to find, let the AI create an initial scoring model and set of filters, review the rules, modify anything you disagree with, then rank and test the resulting selection.
Disclaimer: This article is provided for educational and informational purposes only and does not constitute investment advice, a recommendation, or an offer to buy or sell securities. Screening results and historical backtests depend on the underlying data, assumptions and methodology. Past performance and simulated historical results are not indicative of future performance.