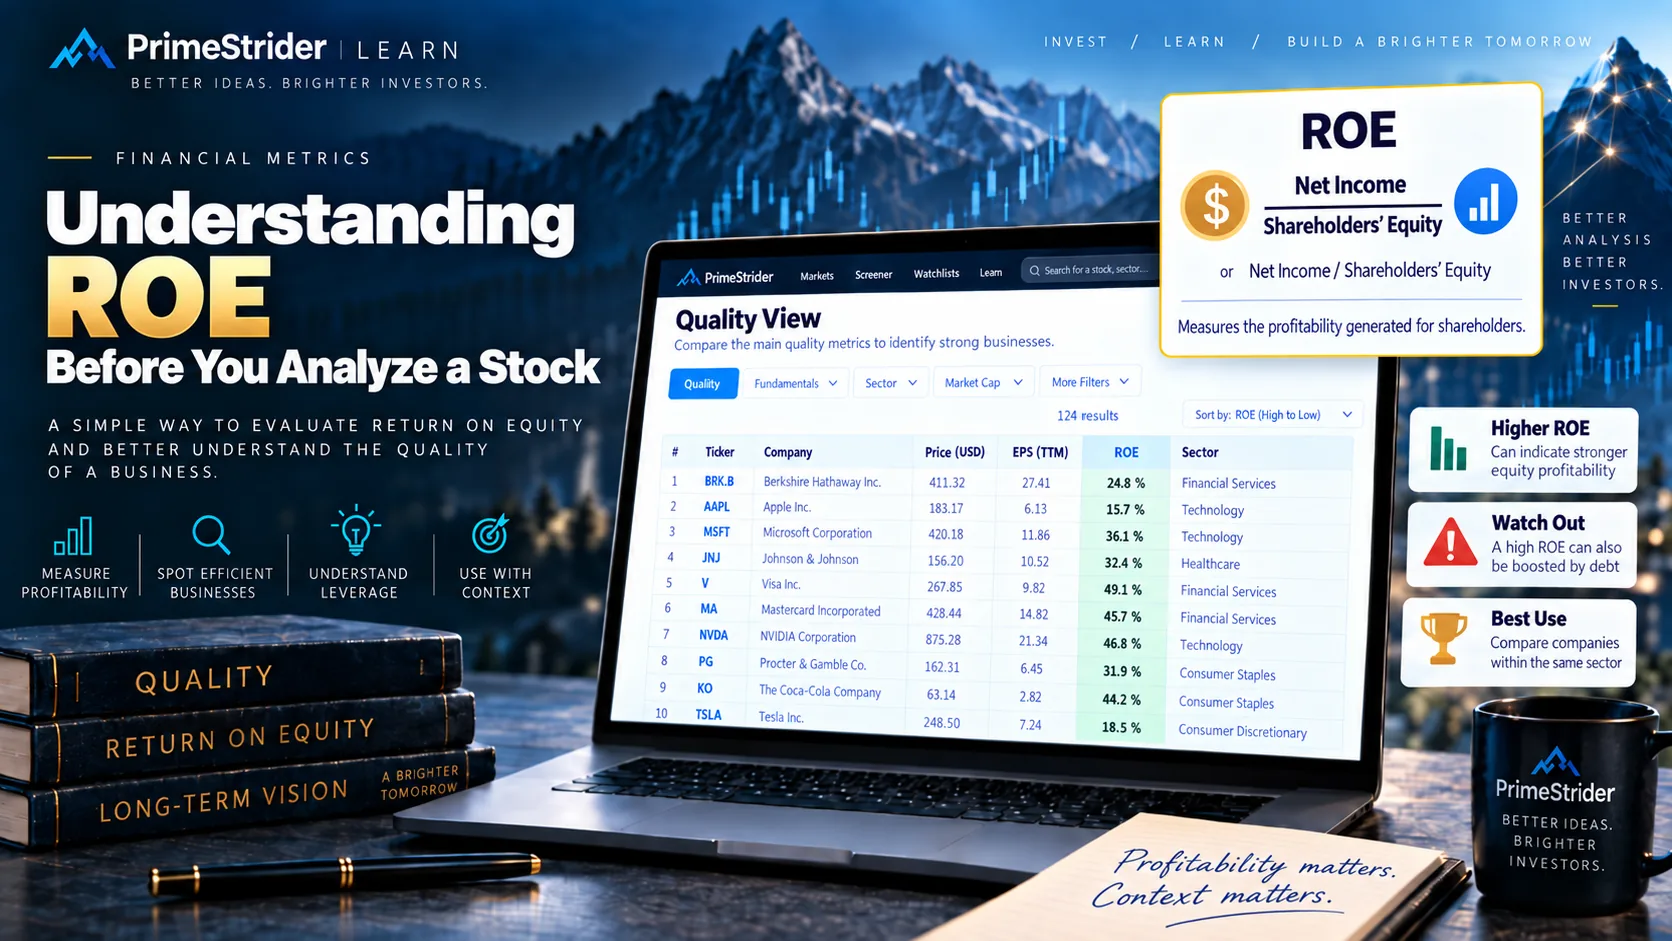
Return on Equity, usually abbreviated as ROE, is one of the most widely used profitability ratios in fundamental analysis. It connects the profit a company generates with the accounting capital provided by its shareholders.
How much profit does a company generate for each euro of shareholders' equity?
A company earning €1 billion may sound impressive. But that number means little without knowing whether shareholders had to provide €2 billion, €10 billion or €50 billion of capital to support the business. ROE puts the profit into perspective.
ROE in one formula
A simple example
Net income generated during the year.
Average shareholders' equity supporting the business.
Understanding the numerator: Net Income
The numerator is the top half of the formula. For most companies, it is net income attributable to shareholders.
Net income is what remains after operating expenses, depreciation, interest, taxes and other expenses have been deducted.
Higher net income increases ROE if equity stays unchanged. But investors should also ask why profits increased. An improvement driven by stronger sales and margins is different from a temporary gain caused by an asset sale, tax benefit or accounting adjustment.
Understanding the denominator: Shareholders' Equity
The denominator is where ROE is often misunderstood.
In simplified form:
If a company owns €1 billion of assets and has €600 million of liabilities, the residual accounting value belonging to shareholders is €400 million.
That €400 million is the capital base against which shareholder profitability can be measured.
Why average shareholders' equity is usually better
Net income is earned over an entire period, whereas the balance sheet represents the company's financial position at a particular point in time.
For that reason, analysts commonly use average equity:
| Period | Shareholders' Equity |
|---|---|
| Beginning of year | €400m |
| End of year | €600m |
| Average equity | €500m |
Using only the €600 million year-end figure would compare a full year of profits against capital that was not necessarily available throughout that entire year.
A simple mental model for ROE
Think of shareholder capital as the input, the company as the economic machine, and net income as the output.
What does a high ROE mean?
A high ROE can indicate that a business uses shareholder capital efficiently.
| Company A | Company B | |
|---|---|---|
| Net Income | €100m | €100m |
| Average Equity | €500m | €1,000m |
| ROE | 20% | 10% |
Both companies generate exactly €100 million of profit. But Company A needs only €500 million of shareholder capital, while Company B needs €1 billion.
Company A therefore generates twice as much profit for each euro of accounting equity.
What is a good ROE?
There is no universal ROE threshold that automatically makes a company attractive.
A 10% ROE may be strong in one industry and mediocre in another. Banks, industrial companies, software businesses and consumer brands have fundamentally different capital structures.
Compare the company's ROE with economically similar businesses.
A strong multi-year ROE is usually more informative than one exceptional year.
Investigate margins, asset efficiency, financial leverage, buybacks and unusual accounting effects.
Why ROE matters to long-term investors
ROE becomes particularly interesting when a company can retain profits and reinvest them at attractive rates of return.
| Year | Illustrative Equity Base | ROE | Illustrative Profit |
|---|---|---|---|
| 1 | €100 | 20% | €20 |
| 2 | €120 | 20% | €24 |
| 3 | €144 | 20% | €28.8 |
If a company can repeatedly reinvest retained earnings while maintaining high returns, profits can compound over time.
The biggest ROE trap: debt can make ROE look better
A high ROE does not automatically mean that the underlying business is exceptionally profitable.
Financial leverage can make the denominator much smaller and therefore increase ROE.
Company B earns less profit, yet reports a much higher ROE because shareholders finance only a small part of its asset base.
Share buybacks can also increase ROE
Share repurchases can reduce book equity. If profits remain unchanged while the denominator falls, ROE rises mechanically.
| Before Buybacks | After Buybacks | |
|---|---|---|
| Net Income | €100m | €100m |
| Equity | €500m | €400m |
| ROE | 20% | 25% |
Nothing changed in operating profit. The ratio improved because the denominator became smaller.
ROE can become misleading when equity is very small or negative
Because equity sits in the denominator, a very small positive equity base can produce extraordinarily high ROE figures.
If shareholders' equity becomes negative, conventional ROE can become even harder to interpret. A profitable company may mathematically report negative ROE simply because its denominator is negative.
Breaking ROE apart: DuPont analysis
A powerful way to understand ROE is to decompose it into the economic forces driving the final number.
Two companies can therefore report exactly the same ROE for completely different reasons.
One may have exceptional margins. Another may operate on thin margins but turn its assets very efficiently. A third may achieve the same ROE primarily through leverage.
That is why understanding where ROE comes from is often more valuable than simply reading the headline percentage.
ROE should be analysed as a trend, not a snapshot
One year's ROE provides useful information. A multi-year history provides much more.
A progression like this deserves investigation. Perhaps profit margins are improving. Perhaps assets are being used more efficiently. Perhaps debt is increasing, or share buybacks are reducing book equity.
ROE versus ROA and ROIC
| Metric | Capital base | Question |
|---|---|---|
| ROE | Shareholders' equity | How effectively is shareholders' accounting capital generating profit? |
| ROA | Total assets | How effectively is the company's asset base generating profit? |
| ROIC | Invested operating capital | How efficiently does the underlying business use invested capital? |
ROE is particularly relevant to equity holders, while ROIC can often provide a cleaner view of the economics of the operating business because it considers a broader capital base.
These ratios are generally more informative when analysed together rather than in isolation.
How investors can use ROE in practice
ROE is useful as both a screening metric and a starting point for deeper fundamental analysis.
A robust analysis could combine:
This is substantially more informative than selecting companies simply because their ROE exceeds an arbitrary threshold.
A practical ROE checklist
The key idea to remember
What shareholders earned during the period.
The accounting capital belonging to shareholders.
A high and sustainable ROE can be a sign of a highly efficient business. But the metric becomes much more useful once you understand why it is high.
Go further
Once you understand ROE, the natural next step is to investigate the mechanisms behind it.
Professional analysis rarely stops at “What is the ROE?”
The more useful questions are: Where does the ROE come from? Is it sustainable? Is it improving? And what risks are being taken to generate it?
That shift — from reading a ratio to understanding its drivers — is one of the foundations of fundamental analysis.
Screen companies, compare profitability metrics and analyse financial performance across markets.