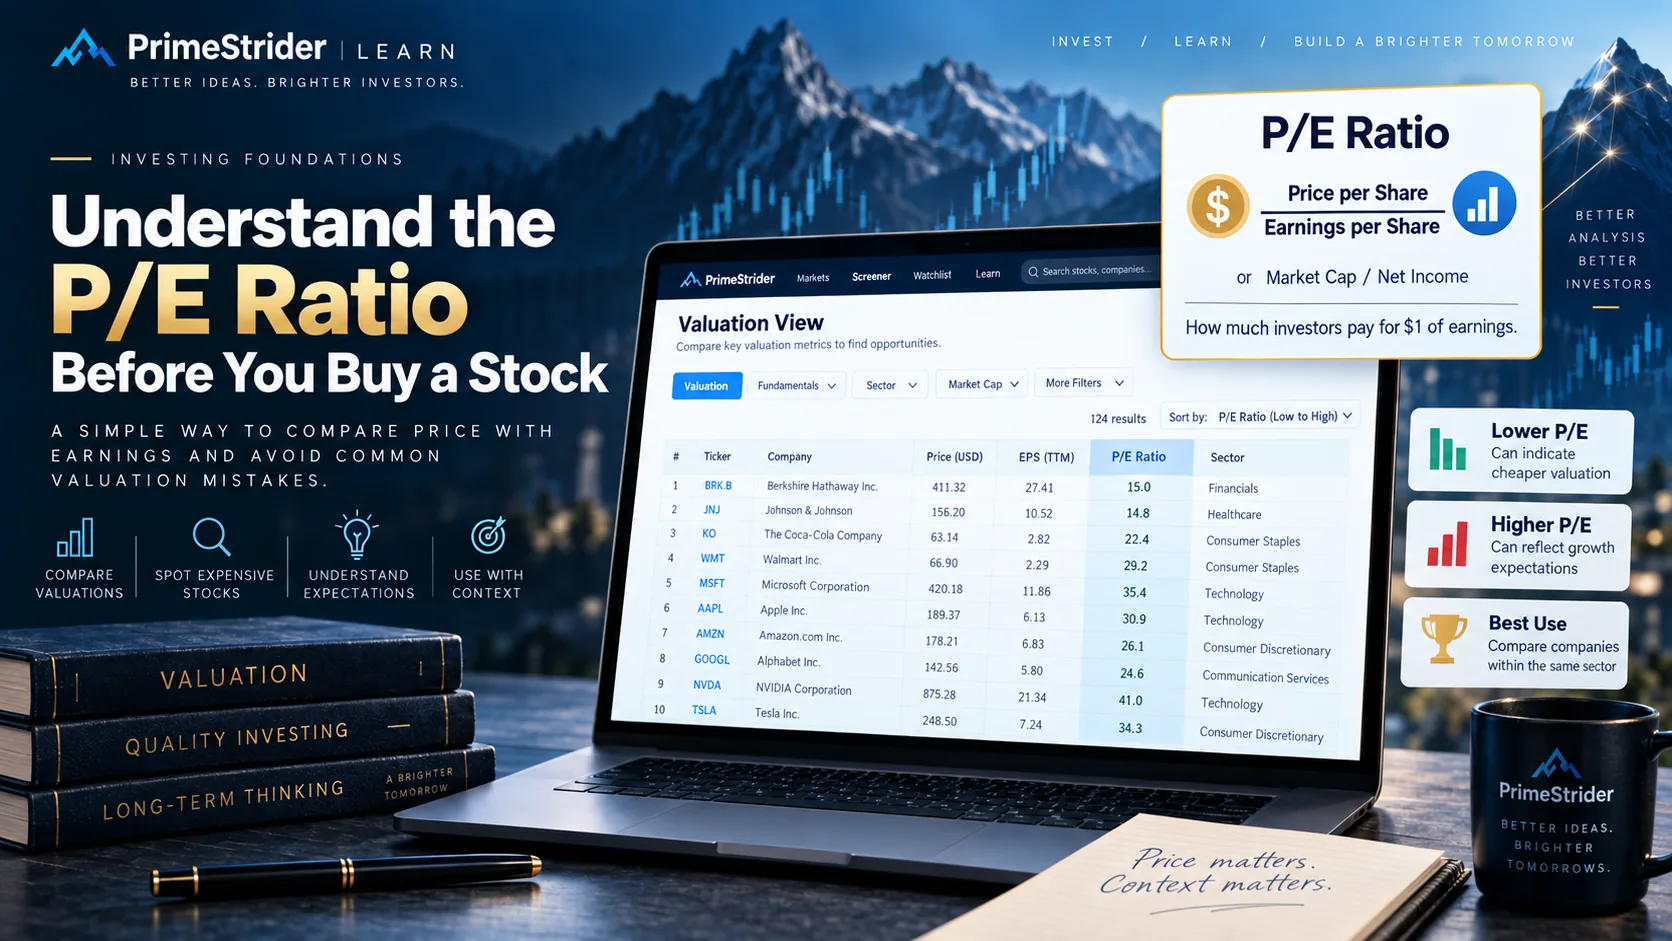
The price-to-earnings ratio—usually called the P/E ratio—is one of the fastest ways to understand how the market values a company. It answers a simple question: how much are investors paying for each unit of annual profit?
The formula
EPS means earnings per share: the company’s profit divided by its number of shares. A P/E of 10× does not guarantee that you will recover your money in ten years. Profits can rise, fall, or disappear, and companies may reinvest them instead of paying dividends.
Trailing or forward P/E?
- Trailing P/E uses actual earnings from the last 12 months. It is factual, but backward-looking.
- Forward P/E uses analysts’ forecast earnings. It looks ahead, but the estimate may be wrong.
Always check which version you are reading. A fast-growing company can have a trailing P/E of 30× and a forward P/E of 22× if profits are expected to increase.
Why the ratio moves
Is a low P/E good?
Not automatically. A low P/E may signal an undervalued company—or falling profits, heavy debt, weak growth, or a business in decline. A high P/E may reflect excessive optimism, but it can also belong to a durable company whose profits are growing quickly.
Context is everything. Banks, utilities, software companies, and luxury brands naturally trade at different valuations. Cyclical companies can even look cheapest near the top of their profit cycle, just before earnings fall.
A five-step beginner check
- Compare the company with similar businesses, not the whole market.
- Compare its current P/E with its own history.
- Check whether earnings are normal or distorted by a one-off gain.
- Review growth, debt, cash flow, and business quality alongside the ratio.
- If earnings are negative, the P/E is not meaningful; use other measures instead.
The takeaway: the P/E ratio is a useful starting point, not a verdict. It tells you the price attached to today’s—or tomorrow’s—earnings. The real analysis begins when you ask whether those earnings are sustainable and whether the market’s expectations are reasonable.
This article is for educational purposes only and does not constitute financial advice.