What happened: Brent crude rose to $98.48 a barrel in early September 8 trading, up 1.5%, while WTI reached $93.79, up 2.5%, according to AP. A wave of Houthi attacks set fires at energy and utility sites in southern Saudi Arabia, temporarily halted operations and wounded 73 people.
Why it matters: the attacks threaten infrastructure linked to Saudi Arabia's alternative Red Sea export route while Strait of Hormuz traffic remains constrained by the U.S.–Iran conflict. Oil is near $100 because the market is pricing a wider set of chokepoint and infrastructure risks—not because a verified volume of Saudi production has already been lost.
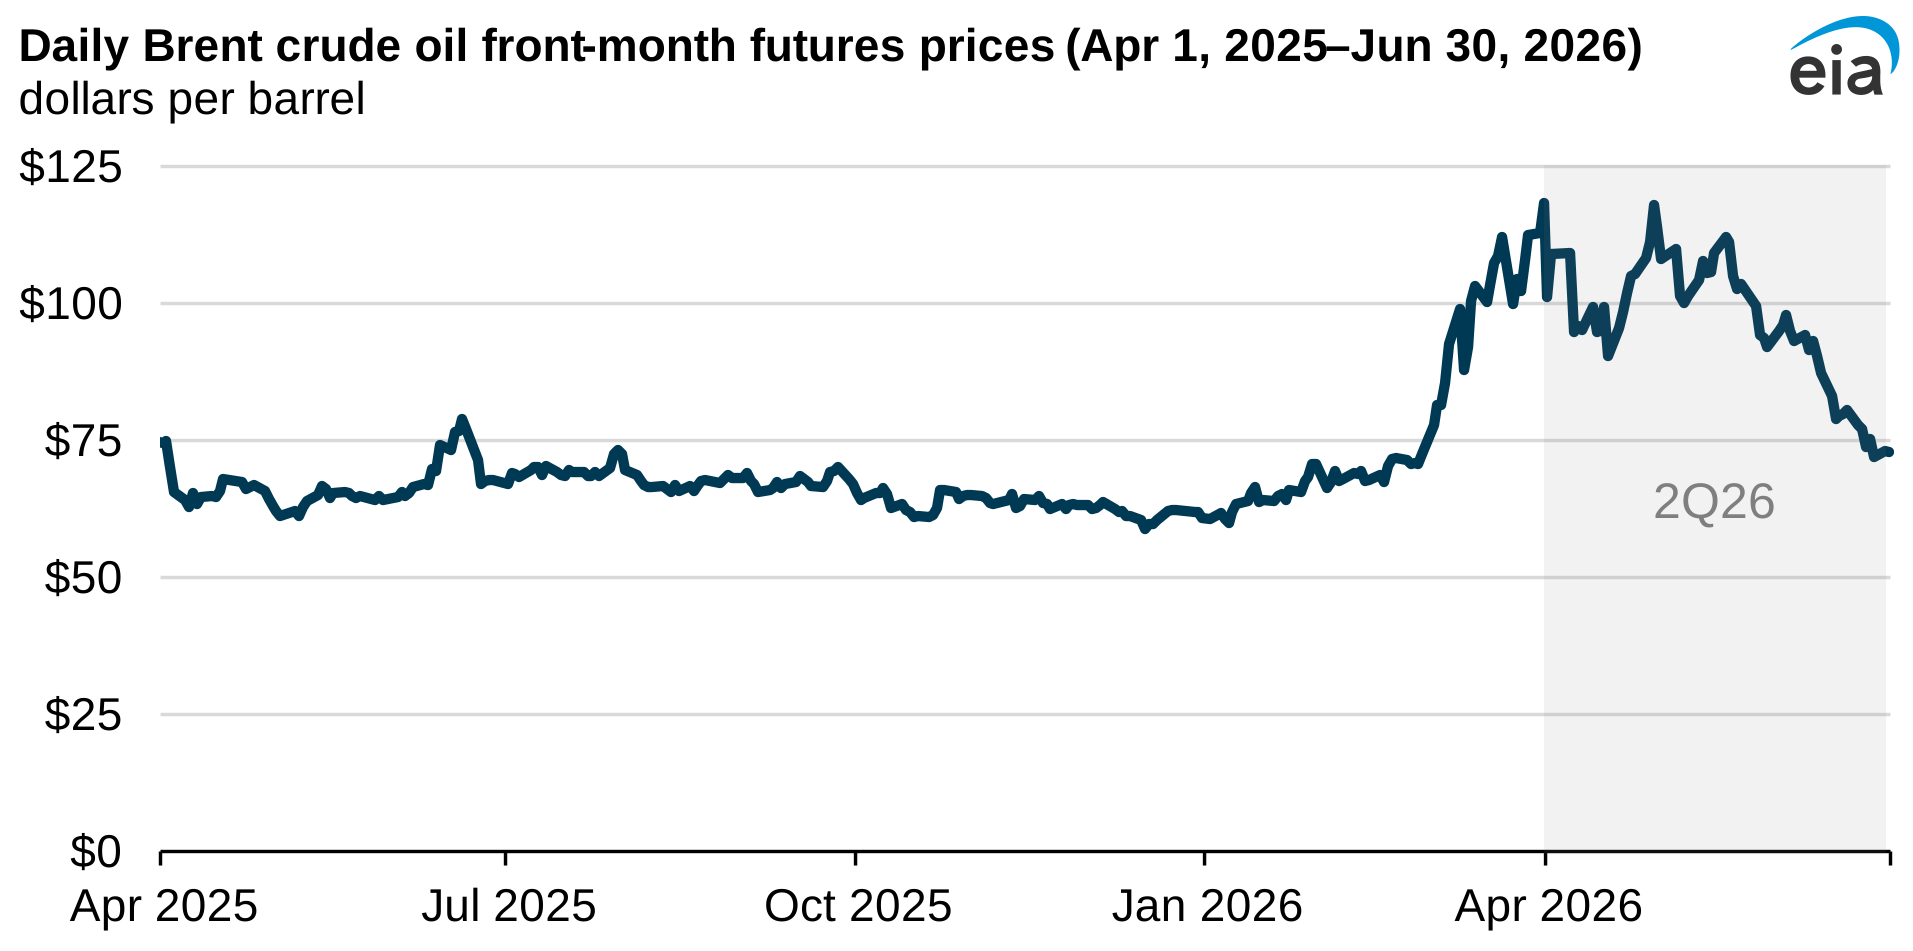
Today's price move reflects risk, not a measured outage
Saudi authorities reported fires and temporary operational stoppages, but had not published a complete damage assessment or confirmed a sustained loss of crude exports when this article was updated. That distinction is essential: price can react immediately to the probability of disruption, while production and shipment data arrive later.
The latest escalation follows renewed U.S.–Iran strikes and Iranian warnings that Gulf energy infrastructure is vulnerable. Reuters reported Brent at $97.34 and WTI at $92.63 around midnight GMT before the Saudi attacks drove benchmarks higher. The sequence illustrates why a single price timestamp can become obsolete within hours in a headline-driven market.
Physical tightness matters beyond the crude benchmark
The EIA's second-quarter review shows the scale of the earlier shock. Brent traded between $72 and $118 a barrel during the quarter. Average daily price swings reached about $4 in April and May, versus $1 in the same months of 2025, while the agency estimated global crude inventories drew by 5.1 million barrels per day.
| Verified indicator | Latest cited figure | Investor implication |
|---|---|---|
| Brent, early Sep. 8 | $98.48/bbl | Near the $100 threshold but below April's $118 high. |
| WTI, early Sep. 8 | $93.79/bbl | Higher U.S. feedstock value and inflation sensitivity. |
| 2Q26 global inventory draw | 5.1m b/d | Less buffer if Gulf shipments weaken again. |
| U.S. gasoline crack spread | +60% y/y in 2Q26 | Refining margins may outperform crude producers' simple price beta. |
| U.S. distillate and jet cracks | More than double y/y | Transport users face a refined-product squeeze, not just higher crude. |
U.S. distillate exports averaged 1.56 million barrels per day in the second quarter, 30% above the five-year average, and jet-fuel exports averaged 356,000 barrels per day, more than double the five-year average. For investors, refinery availability, product inventories and shipping access can therefore matter as much as the Brent headline.
Cash-flow and macro implications
Upstream producers: higher realized prices can lift revenue, operating cash flow and distributions, but the benefit depends on hedges, royalties, taxes and whether volumes can physically reach customers.
Refiners: tight diesel and jet-fuel supply can widen margins, though outages, expensive crude and working-capital requirements create offsetting risks.
Airlines, logistics and chemicals: higher fuel and feedstock costs pressure margins unless surcharges, pricing power or hedges absorb the shock. Companies with weak balance sheets are most exposed if the disruption persists.
Rates and consumption: sustained energy inflation can keep central banks restrictive and reduce household real income. That second-order effect can weaken equity valuations and demand even when oil-company earnings improve.
$120 is a tail scenario, not the base case
Goldman Sachs reportedly raised its December 2026 Brent forecast by $5 to $85 and its 2027 forecast to $80. Its oil-above-$120 scenario assumes average Gulf production in 2027 remains 4 million barrels per day below pre-war levels, versus a 0.5 million-barrel shortfall in the base case. Presenting $120 without those assumptions would overstate the forecast.
The bullish oil case requires lasting damage, renewed shipping attacks or lower-than-expected inventories. The bearish case is operational recovery, improved Hormuz and Red Sea transit, demand destruction or a diplomatic reopening that removes the risk premium.
What investors should monitor next
- Saudi damage assessments, restart timing and confirmed production or export losses.
- Tanker movements through both Hormuz and Bab el-Mandeb, including insurance and freight rates.
- Brent backwardation, regional crude differentials and diesel and jet-fuel crack spreads.
- Commercial inventory data and the EIA Short-Term Energy Outlook due September 9.
- Whether higher energy prices feed into inflation expectations, central-bank guidance and corporate margins.
Prices and event information are current as of September 8, 2026. Forecasts are scenarios, not certainties.